Australia’s economic commentators have suddenly discovered per capita GDP for measuring Australia’s economic performance. This is a good thing, and should have been adopted earlier, rather than just before this election. Per capita GDP is what matters, rather than GDP, because it doesn’t incorporate the rate of population growth. Size of a economy says nothing about the wealth of individuals, which is the paramount value worth studying.
The measure has been used to attack the credibility of the government’s economic performance, but since 1974 when the seasonally adjusted GDP figures began, both sides have experienced periods of negative growth per capita that weren’t necessarily captured by the gross GDP figures
What our analysis shows is that:
- Since 1991 when the period of uninterrupted growth measured by GDP commenced there have been two GDP per capita recessions.
- Both GDP per capita recessions happened under Liberal governments – one in 2006 and one in the December and March quarters of this financial year.
- Annual growth is still positive.
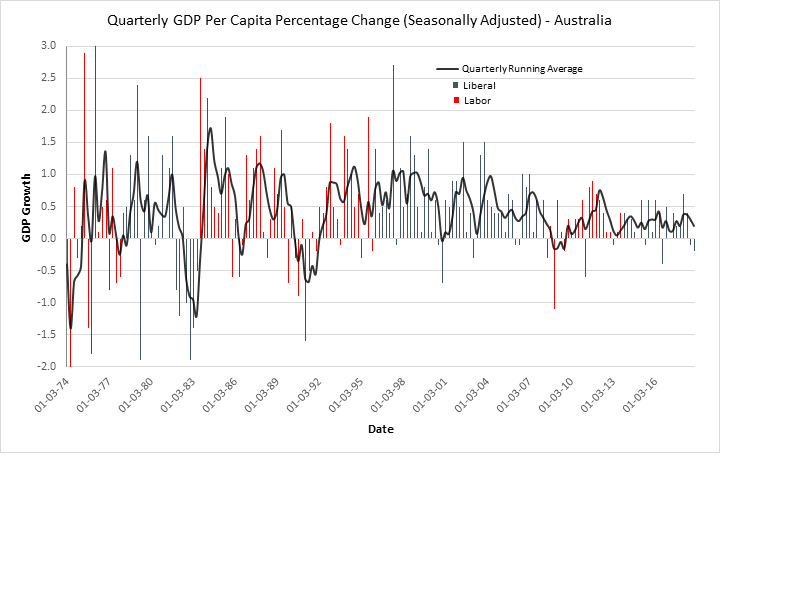
- In the years since Labor won in 2007 there has been one period of 12 months where, despite a technical recession being avoided, the average of that period’s quarterly GDP growth was negative (see the quarterly average on the bar graph). This was in 2008 when Wayne Swan was treasurer.
- During the 98 quarters the Coalition has been in government since 1974 (when the GDP per capita series begins) there has been an accumulated increase in GDP of 38.9% and an average quarterly percentage growth of 0.4%.
- During the 82 quarters Labor has been in government since 1974 there has been an accumulated increase in GDP of 33.6% and an average quarterly percentage growth of 0.41%.
- Growth has been more volatile under Labor. During the period since 1974 there have been 23 quarters of negative growth under Labor, which means that 28% of the time during Labor’s time in government we have undergone economic decline.
- Growth has been less volatile under the Coalition. During the period since 1974 there have been 21 quarters of negative growth under the Coalition, which means that 21% of the time during the Coalition’s time in government we have undergone economic decline.
- The Coalition has seen an accumulated increase in GDP of 6.7% during the 25 quarters it has been in government since 2007. The average quarterly GDP growth under the Coalition since 2007 is 0.27%.
- The Labor Party has seen an accumulated increase in GDP of 4.9% during the 23 quarters they have been in government since 2007. The average quarterly GDP growth under the Labor Party since 2007 is 0.21%.
 Source ABS 5206 Australian National Accounts
For a PDF version of this paper, click here.