There was actually a jump in global temperature last month, caused by sinking air in the stratosphere over the Antarctic. You can read about it at Roy Spencer’s blog by clicking here. It’s an eye-opener into just how complex temperature can be.
Meanwhile, the lower tropospheric temperature over Australia, which we are showing here, was hotter than average, but only the 15th hottest in the satellite record.
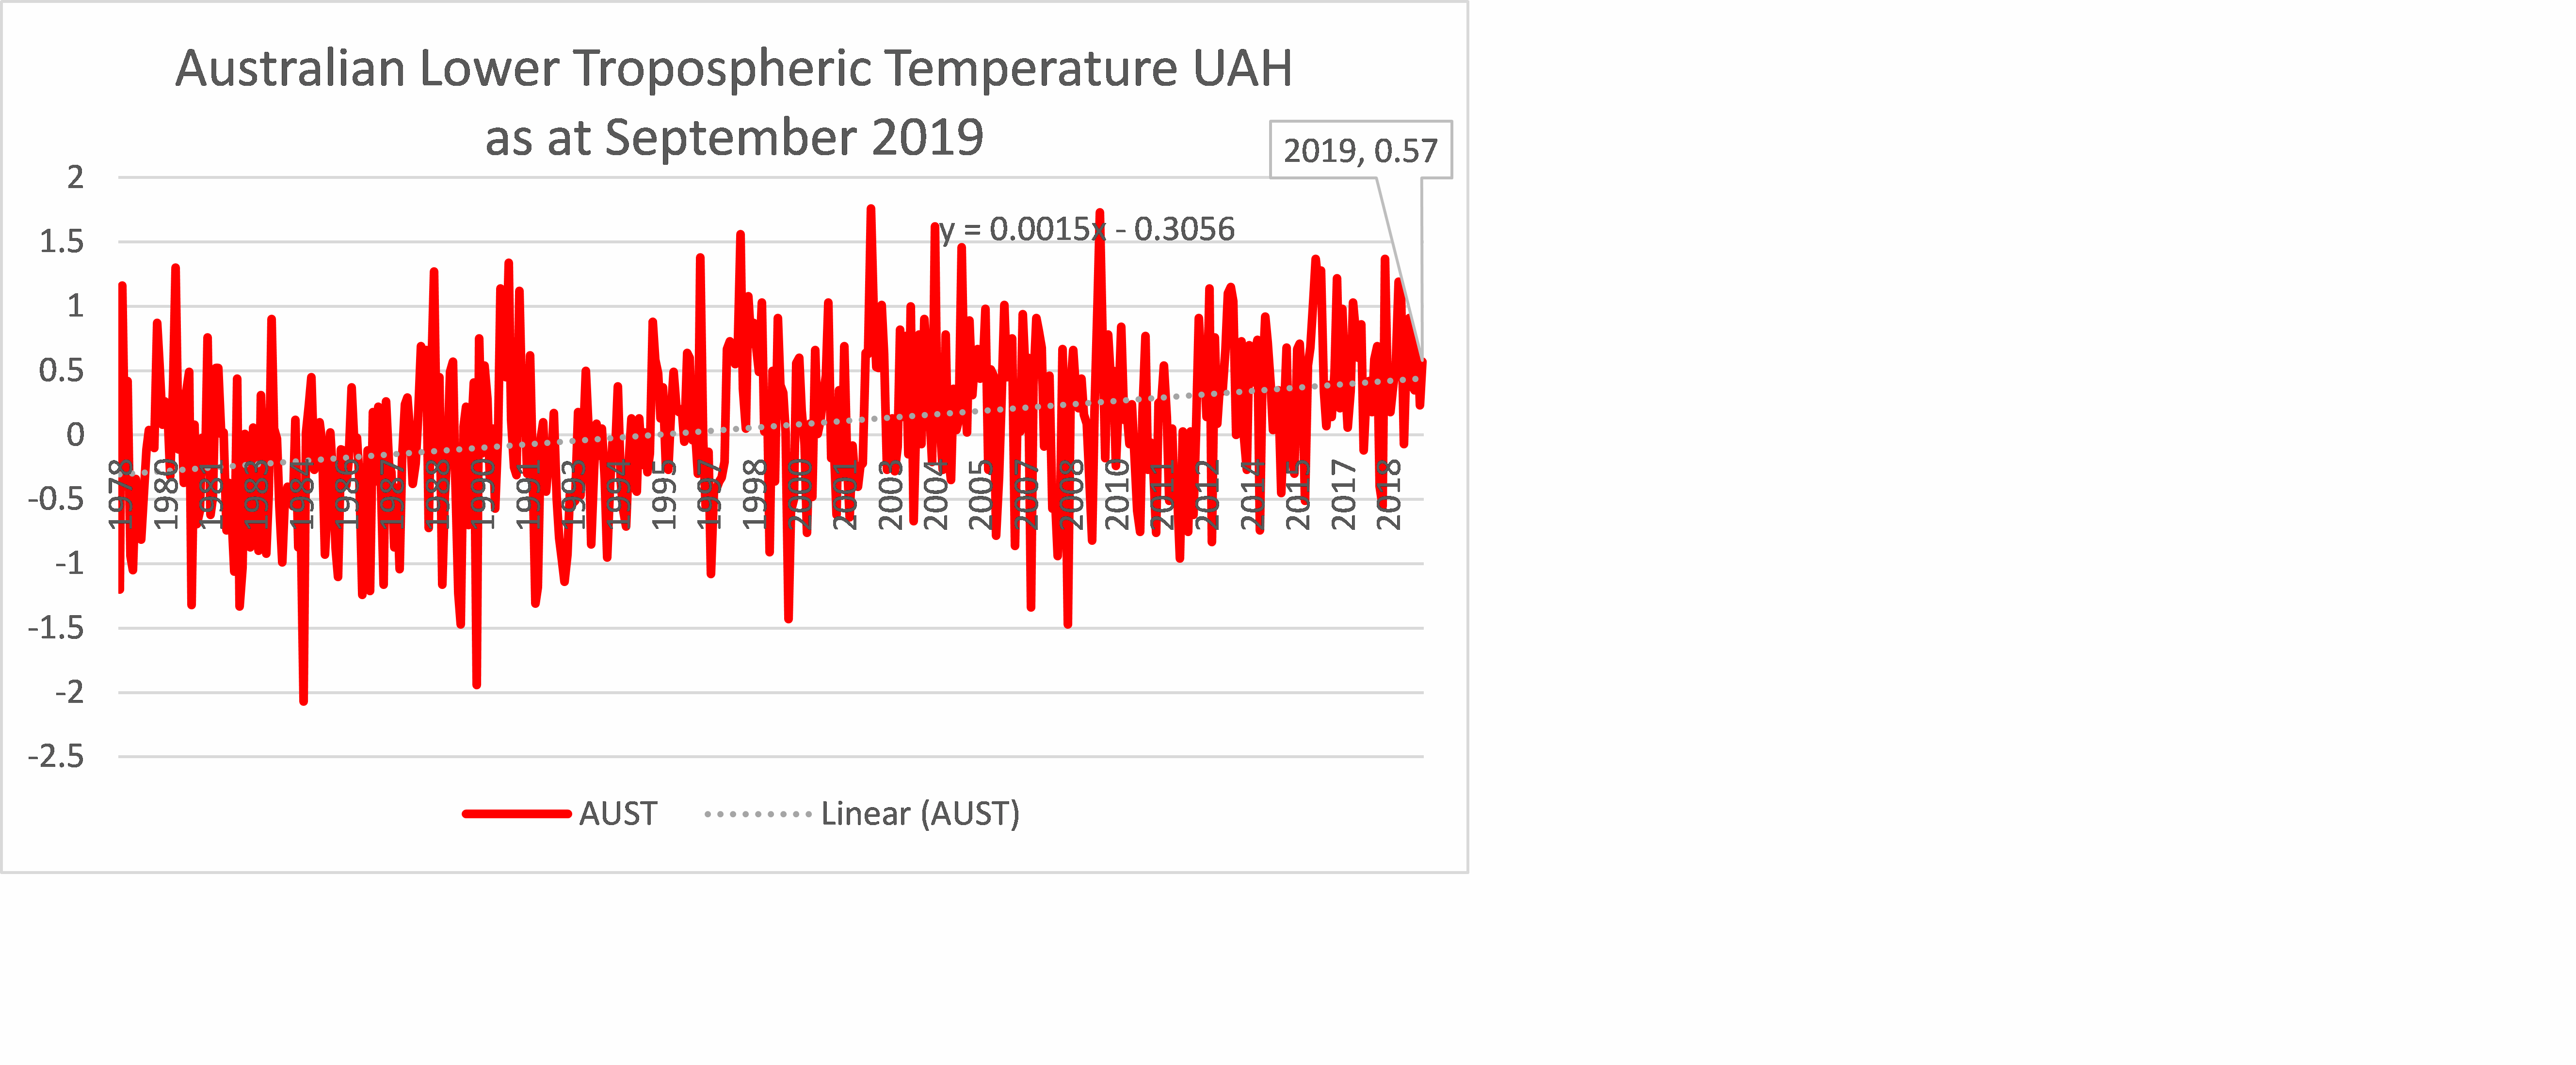
This graph is derived from measurements taken by Spencer and Christy at the University of Alabama, Huntley campus using satellite measurements which infer temperature from microwave radiation. We prefer this measure to the ground-based measurements because it is global, and not subject to issues like the urban heat island effect.
Some people object to the satellite measurements because they don’t measure heat directly, but then neither does any other instrument. Instead of microwaves traditional thermometers use the expansion in a column of mercury to estimate temperature. Modern electronic probes infer it from the impedence of an electric current caused by temperature.
The current trend is consistent with 1.8 degrees of temperature rise in 100 years. There is no sign of any acceleration. You can download the dataset from here: http://www.drroyspencer.com/latest-global-temperatures/.