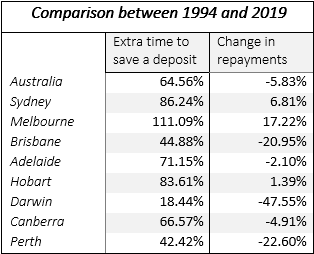
Our data now span 25 years, extending from the fourth quarter 1994 to the third quarter 2019. So in addition to our normal analysis which compares the last two quarters we have looked at housing affordability over the last 25 years. It is now 5.83% cheaper for the average Australian to repay an average housing loan than it was in 1994, but it takes the average Australian 65% longer to save the deposit.
To download the report click here.
The new federal government mortgage guarantee scheme tackles the right aspect of the housing affordability issue, and repayment capacity appears to be historically adequate.
The story across cities is mixed. Darwin repayments are 47.55% cheaper than they were 25 years ago, while Melbourne’s are 17.22% more expensive. Perth is 22.69% cheaper and Brisbane is 20.95% cheaper, while the remainder of capitals show little change. Melbourne is the city with most housing discomfort as not only are repayments up substantially, but it takes 11% longer to save the deposit. If it’s any consolation it also has the best house price appreciation in Australia.
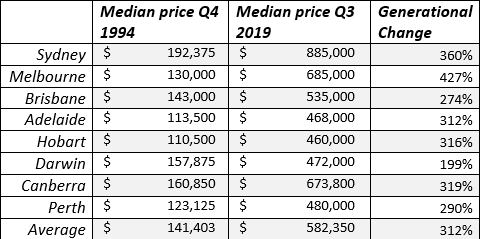
A corollary of these figures is that the best capital city real estate market to be invested in over the last quarter of a century was Melbourne, where average prices increased faster than Sydney. While Melbourne started out more affordable, it is now less affordable than Sydney.
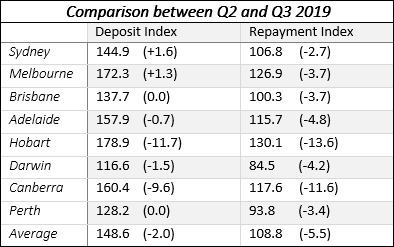
Looking at the short term the 2019 Quarter 3 Australian housing market saw an increase in the affordability of both housing deposits and repayments.
On average, repayment costs across Australia are even more affordable now than they were at the depth of the GFC housing market crash. In fact one has to go back to 2003 to find affordability at better levels. Deposit costs are at the level experienced in 2015 Q1.
Save for Sydney and Melbourne, the decrease in deposit costs is consistent across all capital cities with Hobart and Canberra experiencing the greatest reduction in costs. Hobart and Canberra also experienced the greatest increase in deposit costs between 2019 Q1 and 2019 Q2, suggesting these markets have the greatest demand and/or lack of supply.
Housing repayment costs have fallen across all capital cities, with the increase in median house prices in Sydney and Melbourne being offset by declining interest rates.
We measure repayment affordability by using ABS statistics for median house prices and calculating the ratio of repayments to average weekly earnings and expressing it as a percentage of the average for the first 10 years of the series to produce an index figure. We measure deposit affordability by calculating the ratio of an average 20% deposit to average weekly earnings and expressing it as a percentage of the average figure for the first 10 years of the series to produce an index figure.
To read the whole report click here