The latest edition of the AIP’s Housing index shows why the HomeBuilder scheme has been so successful, and also explains evidence that house sales have been buoyant during the pandemic.
Download the report by clicking here.
In the June quarter (the latest available from the ABS) home affordability measured by repayments was back to 2002 levels.
Deposits are not as affordable as repayments, having been easier to afford in 2015, however that is not generally a concern for second and subsequent house buyers, and may not trouble a number of first home buyers who have access to parental resources, or are buying very affordable properties.
The increase in affordability is driven by two things directly related to the pandemic – a drop in interest rates, and a drop in house prices.
There was also an increase in average wages, which is an artefact of the pandemic taking more lower-paid workers out of employment than higher-paid workers.”
Mr Young said that the HomeBuilder scheme was well-pitched as it dealt with the deposit gap, which is the real financial issue keeping buyers out of the market.
With these affordability figures it made it the best time in almost 20 years to get into the housing market.
From the report:
The housing repayment-deposit gap shrank. In all capital cities, save Canberra and Adelaide, both deposit and repayment costs significantly decreased due to a fall in median house prices of 1.55% ($9,462) and an increase in average weekly earnings of 1.86% ($32) across Australia.
The total number of weeks to raise a deposit, given a 10% savings rate, dropped by an average of 23.9 weeks across Australia and, most notably, 62 and 61 weeks in Melbourne and Sydney. Similarly, the proportion of yearly income used to cover repayments has fallen by 1.3% across Australia, which represents yearly savings of $1178.5.
The most affordable cities for repayments were Perth, Darwin and Brisbane. Despite the pandemic lockdowns Melbourne was still in the top three most unaffordable, even though it experienced the greatest increase in affordability due to a plunge in prices.
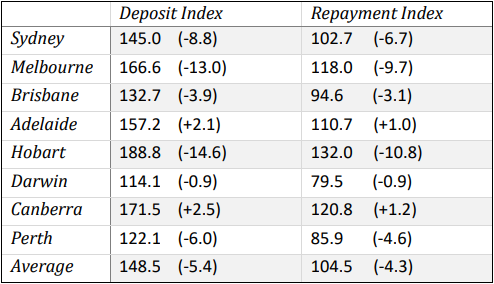 Note: The period between 1994 and 2003 had an average index number of 100