The latest edition of the AIP’s Housing Affordability Index shows house repayments continuing to be affordable on historical comparisons, while deposits continue to be relatively unaffordable. You can download the report by clicking here.
Our Q3 2020 calculations have been revised to use an average weighted for the number of house sales in each capital. This means that previous reports are now superseded as there are a number of minor variations.
The third quarter of 2020 saw housing affordability increase in three of the capitals most affected by COVID-19 – Melbourne, Sydney and Hobart – while it decreased in those least affected by it – Brisbane, Perth, Canberra and Adelaide.
These changes were largely a result of decreases or increases in housing prices, but may also have been driven by internal migration with the latest ABS release of provisional Interstate Migration (ABS catalogue number 3412.0.55.005) showing population decreases in NSW, Vic, and ACT, and minor increases in SA, Tas and WA, and significant increases in Qld.
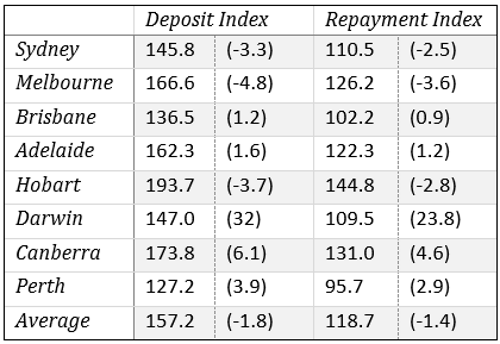
The repayment index figure for the September Quarter 2020 is 118.7, compared to 120.1 in the previous quarter, an improvement of 1.4 percentage points. For deposits the figure is 157.2, an increase in affordability of 1.8 percentage points since the previous quarter.
These affordability figures are better than the average for the last 20 years, suggesting that current house price buoyancy is sustainable.
This is the first quarter since the federal government introduced its HomeBuilder grant. It has been claimed (for example here) that this will inflate the price of housing, ultimately making it less affordable.
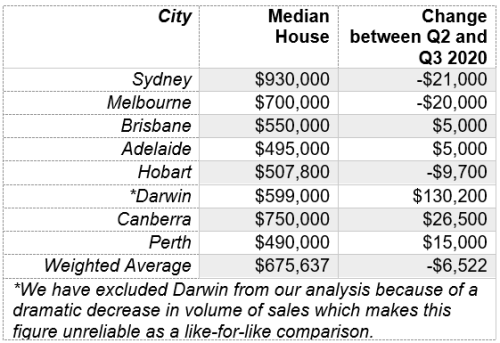
Outside our report we checked this claim against the median figures, and it is a claim that does not generally appear to hold true. The grant was $25,000 for a new build or renovation of an existing structure costing over $150,000.
In theory this could lead to a $25,000 increase in the price of a house. However, house prices fell by an average of $6,522 across the country, reflecting large falls and volumes in Sydney (-$21,000), Melbourne (-$20,000), and Hobart (-$9,700). Rises were modest in Brisbane and Adelaide ($5,000), moderate in Perth ($15,000) and substantial in Canberra ($26,500).
This suggests that if the grant has had an inflationary effect, it did not manifest in the median house price in the quarter immediately following its announcement, but may have manifested in Perth and Canberra.
From the report:
The 2020 Quarter 3 Australian housing market featured diverse changes in the affordability of both housing deposits and repayments dependent on city. Repayments and deposits fell in Sydney, Melbourne, and Hobart though rose in Brisbane, Adelaide, Darwin, Canberra, and Perth. Aggregating across Australia, housing repayments and deposits decreased by 1.4 and 1.8 index points respectively. The increase in national housing affordability is the result of significant declines in median house prices in Sydney and Melbourne. This is despite Melbourne, which is typically one of the most unaffordable cities, having nearly halved its share of national established housing transfers from 25% to 15%.
The least affordable city is Hobart, followed by Canberra, Melbourne and Adelaide. Most affordable is Perth, followed by Brisbane and then Sydney.