Our Housing Affordability Index for the second quarter 2021 shows a general decrease in affordability and Australia’s two largest capitals at, or close to, historical peaks of unaffordability on both repayments and deposits. Download the full report by clicking here.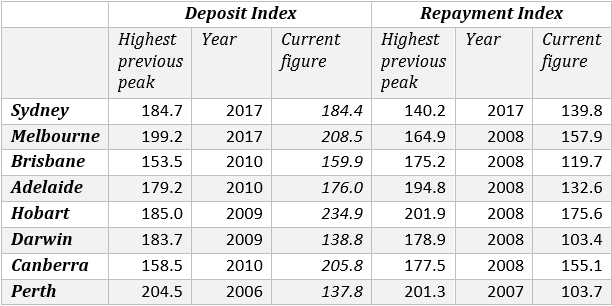
This is particularly true of Sydney where the index figure for repayments is 139.82, virtually identical to previous peaks in 2017 (140.170), 2008 (138.99) and 2004 (139.03). The deposit index is 184.45, 0.2 different to 2017 which was a record high.
The affordability index relates to the average for the period of 1994-2004 which is assigned a figure of 100. Higher figures mean less affordability and lower more affordability. Our model combines income, housing prices and lending rates to compare the effort required to buy a house as it fluctuates over time.
The Melbourne repayment index is currently on 157.9, which compares to 163.77 in 2010 and 164.85 in 2008. Its deposit index is 208.5, an absolute record.
History suggests that current house prices are unlikely to be maintained in Sydney and Melbourne unless there is an increase in earnings or a further decrease in interest rates.
At some stage the costs of home ownership have to get to be too high causing buyers to moderate their expectations or withdraw from the market all-together.
High prices also tend to draw more product onto the market, and this can accelerate if vendors fear they might miss the top of the market and be selling into one in decline.
We believe the repayments index is the crucial one. Saving a deposit has never been harder, but once it is saved it disappears as an issue, but repayments continue to be an issue for the life of the loan.
Houses are still fairly affordable in Perth, Darwin and Brisbane, which affects the total Australian index, which is weighted for sales around the country and still shows reasonable affordability.
Perth buyers are able to purchase a house with virtually the same effort it took in the 90s with a repayments index of 103.7, although saving the deposit is more difficult with an index of 137.85.
In Darwin the relevant figures are 103.4 and 138.75, while Brisbane is 119.7 and 159.93.
Adelaide is next on 132.6 and 176, while Canberra at 155.1 and 205.8 is level-pegging with Melbourne for housing unaffordability.
Hobart is the least affordable city in Australia with repayments at 175.6 and a deposit 234.9.