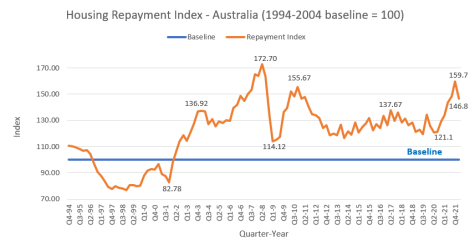
There was an increase in housing affordability in Australia in the first quarter of this year. This reflected a fall in house prices and may be a temporary respite as interest rates have risen since then, which will have the effect of putting upward pressure on repayments, unless house prices have further to fall. To download our latest report, please click here.
The repayment index dropped from 159.7 to 146.8. While this is an 8 percent increase in affordability it should be noted that it is 46.8% higher than the base of 100, which is the average for the period between 1994 and 2004, and a marker for what has been historically affordable. There was also a similar drop in the deposit affordability index.

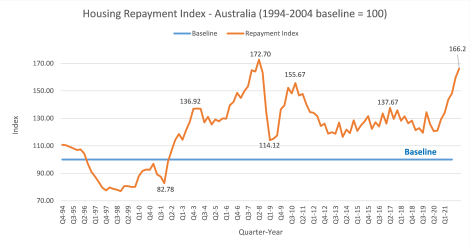
Interest rates have risen substantially since the March quarter. To get an idea of the effect of this, even given lower dwelling prices, we adjusted interest rates in the model to the RBA home loan indicator lending rate at the end of the second quarter.

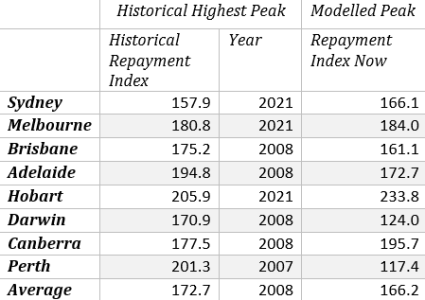
That moved the repayment index back above the December quarter peak and within 6.5 index points of the all-time high for unaffordability. (It doesn’t affect the deposit affordability index which is tied to the capital value of the property).
When broken down into its component capital cities, Sydney, Melbourne, Hobart and Canberra would each be at record levels of repayment affordability. Perth and Darwin would still offer reasonable value, and Brisbane and Adelaide are at high, but not record unaffordability.
If one believes that unaffordability has peaked, our model predicts that median Australian house prices will need to decrease by around 19% to stop affordability deteriorating further at the rates which now prevail.
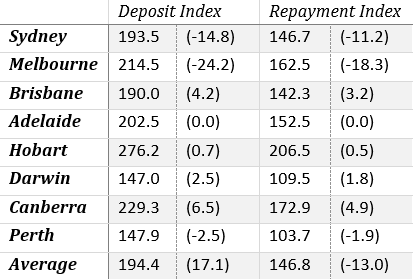
This first table shows the current affordability figures for deposits and repayments.

The second table holds all values steady apart from increasing interest rates to what obtained at the end of the second quarter. When the ABS updates its data for the second quarter we will have real figures for this.
