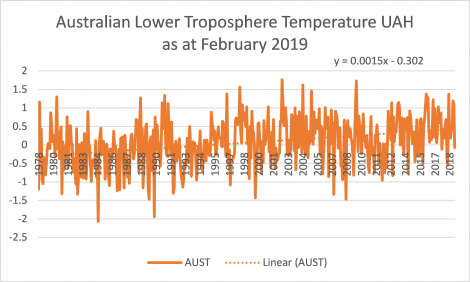
This is the first of what will be a monthly series checking on Australia’s temperature as measured by the University of Alabama Huntley Global Temperature Project. The UAH dataset tracks not just global temperature, but also the temperature for discrete areas of the world, including Australia.
We will contrast it to the Bureau of Meteorology’s record in the interests of accuracy. The AIP accepts that the world has been getting hotter for the last few decades, and that man-made CO2 is a component in this increase. But it is important that the scope of the problem is properly understood, and this can only occur by dispassionate examination of the evidence.
You can read the details here as to how the temperature is measured by the UAH researchers Roy Spencer and John Christy. We prefer the UAH figures to the BOM because it avoids the measurement problems that plague terrestrial measurements, such as the siting and coverage of stations, and homogenisation of temperature records.
The UAH measurements are corrected from time to time, and this is transparently revealed on their website.
The graph below shows Australia’s temperature since the inception of the satellite record. Australia is heating slightly faster than the global average with an increase over the record of 0.18 degrees per decade.

There have been claims that we had our hottest summer ever this year. This is not true on the basis of the UAH dataset. 2019 is not the hottest Australian summer ever, but the second hottest, with 1991, 28 years ago being the hottest. We have calculated this using the average temperature anomaly for the three months of summer.
| Year | Average Anomaly |
| 1991 | 0.776667 |
| 2019 | 0.74 |
| 1998 | 0.68 |
| 2017 | 0.64 |
| 2001 | 0.596667 |
| 2004 | 0.536667 |
| 1999 | 0.516667 |
| 2006 | 0.42 |
| 1997 | 0.38 |
| 1982 | 0.35 |